Introduction to Trading View and Its Core Features
In today’s dynamic financial markets, traders and investors need sophisticated tools that combine deep analytical capabilities with social engagement. Trading view has emerged as a leading platform, offering an integrated environment that caters to both technical analysis and community-driven insights. Whether you’re a day trader, long-term investor, or someone exploring market data, understanding the core features of Trading View can significantly enhance your trading effectiveness and decision-making process.
What is Trading View? An Overview of Its Tools and Community
Trading View is a comprehensive financial analysis platform renowned for its powerful charting tools, real-time data, and vibrant social community. It serves as a hub where traders and investors from around the world can analyze markets, share ideas, and develop strategies. The platform’s intuitive interface makes complex data accessible to both novices and seasoned professionals.
One of Trading View’s defining strengths is its community aspect. Users can publish their trading ideas, comment on others’ analyses, and engage in meaningful discussions. This social dimension fosters collaborative learning and can provide fresh perspectives on market movements. Additionally, the platform supports an extensive range of assets including stocks, cryptocurrencies, forex, commodities, and indices, making it a versatile choice for diverse trading interests.
Key Features of Trading View for Market Analysis
Advanced Charting Tools
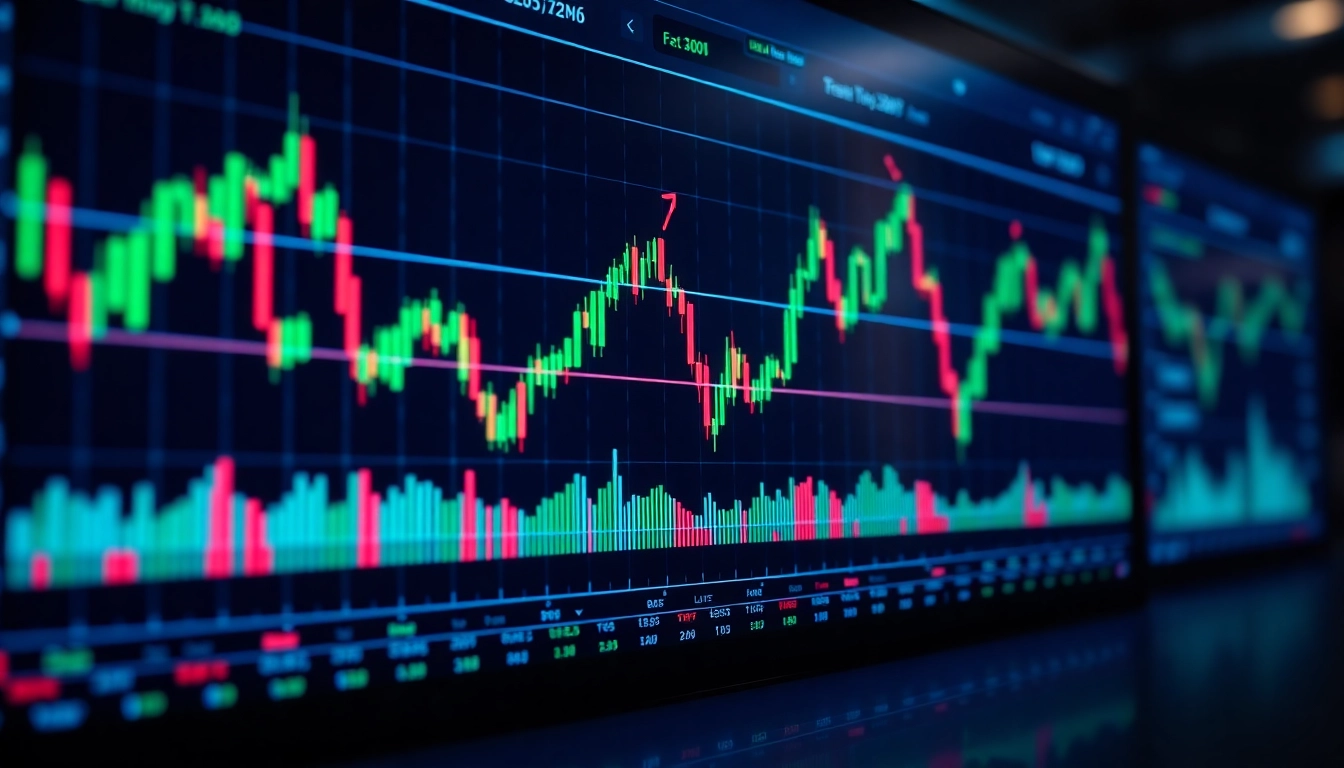
Trading View excels in offering state-of-the-art charting capabilities. Users can access a multitude of chart types—candlestick, bar, line, and more. The platform also provides an extensive library of technical indicators such as Moving Averages, RSI, MACD, Bollinger Bands, and custom scripts through Pine Script. These tools allow traders to perform detailed technical analysis and identify patterns or potential reversal points.
Real-Time Data and Alerts
Real-time data access is critical for active trading. Trading View aggregates live data feeds from multiple exchanges, ensuring traders have the latest market information at their fingertips. Users can set up customizable alerts based on price levels, indicator conditions, or chart patterns, enabling timely execution of trades or strategic adjustments.
Community Ideas and Social Integration
The platform’s social features allow traders to publish their ideas, share analysis, and discuss market developments. This environment is invaluable for gaining diverse insights and validation for trading strategies. The community contributions often include detailed annotations and explanations, fostering a collaborative learning environment.
Multi-Asset Support and Screeners
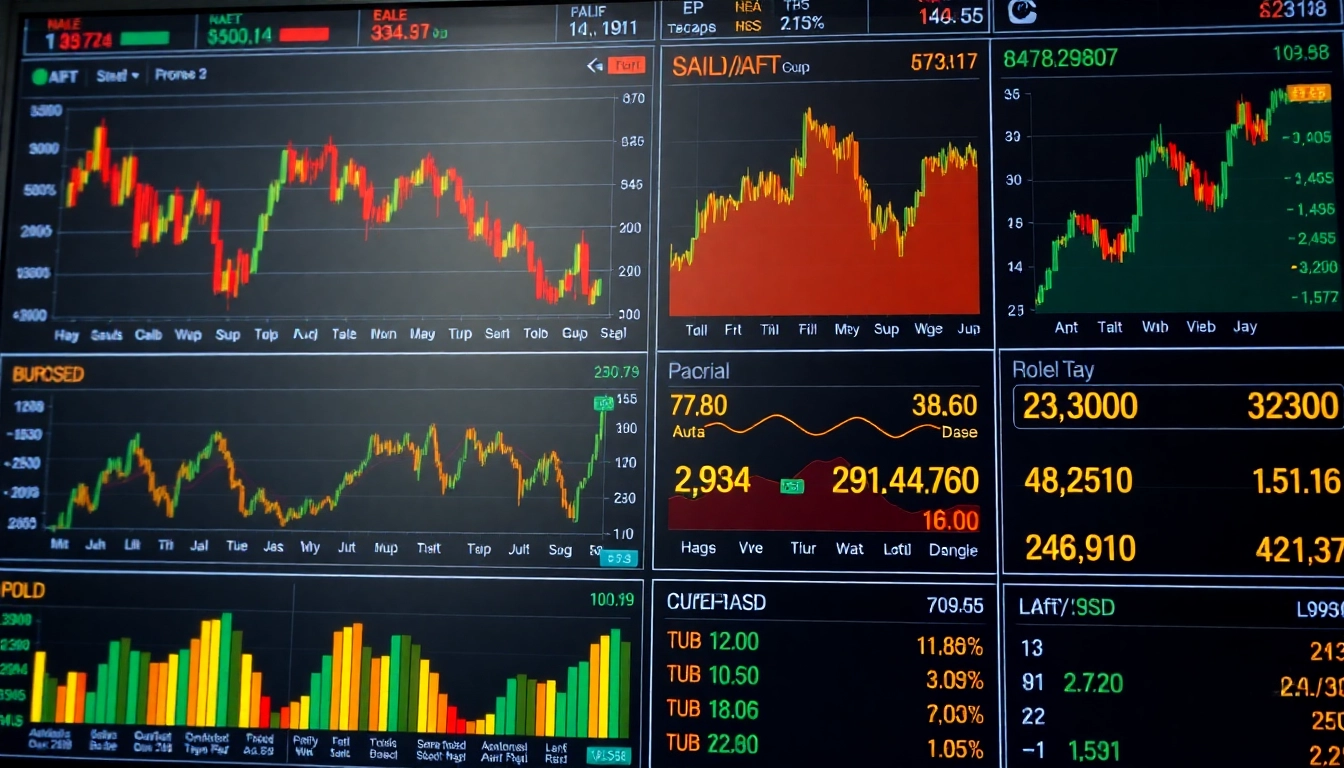
Trading View enables analysis across various asset classes with dedicated tools and screeners. Its stock screener helps identify potential investment opportunities based on custom filters like volume, volatility, or technical indicators. Cryptocurrency and forex support are deeply integrated, providing comprehensive market access.
Benefits of Using Trading View for Traders and Investors
- User-Friendly Interface: Despite its advanced features, the platform remains accessible for beginners, with customizable layouts to suit individual workflows.
- Cross-Device Compatibility: Access Trading View seamlessly on desktop, tablet, or mobile devices, ensuring constant access to market data and tools.
- Community-Driven Insights: Participate in a global network of traders sharing ideas, strategies, and analyses, enhancing decision-making.
- Customization and Automation: Tailor charts with personal templates and automate alerts for faster reaction times.
- Cost-Effective: Freemium model offers extensive features at no cost, with premium plans providing additional capabilities suitable for professional traders.
Leveraging Trading View for Effective Market Analysis
Understanding Chart Types and Technical Indicators
Effective market analysis begins with mastering the available chart types. Candlestick charts, for example, provide insight into market sentiment, while line and bar charts offer a broader trend perspective. Combining these with technical indicators like MACD, RSI, or Fibonacci retracements helps pinpoint entry and exit points. Traders should experiment with multiple configurations to find what aligns best with their strategies.
Setting Up Customized Watchlists and Alerts
Efficiency in trading relies heavily on proactive monitoring. Trading View’s watchlists allow users to categorize assets, track price movements, and personalize their market focus. Setting alerts based on price thresholds or indicator signals ensures no opportunity is missed. For example, a trader might set a quick alert when Bitcoin crosses a significant support level, prompting immediate analysis or action.
Applying Trading View to Stocks, Cryptocurrencies, and Indices
The platform’s versatility is its strength. Stocks can be analyzed using complex technical setups, cryptocurrencies benefit from real-time tracking and social discussions, and indices offer macroeconomic insights. By integrating multiple asset classes within a single interface, traders can develop holistic strategies and diversify their portfolios effectively.
Integrating Trading View into Your Trading Strategy
Developing Technical Strategies Using Trading View Data
Strategic development involves combining multiple indicators and chart patterns for a comprehensive view. For instance, a trader might use Moving Averages for trend identification, RSI for overbought/oversold conditions, and chart patterns like head and shoulders for reversal signals. Backtesting these combined strategies within Trading View helps assess historical performance before live deployment.
Using Social Features for Peer Insights and Idea Sharing
Community engagement enhances learning and often sparks new trading ideas. By analyzing top shared ideas and commentary, traders can discover novel approaches, validate their own theories, or avoid potential pitfalls. The platform’s social annotations and discussion threads lead to a richer understanding of market nuances.
Implementing Trading View’s Backtesting and Simulation Tools
Before risking real capital, traders should test strategies through Trading View’s backtesting engine. This feature allows simulation over historical data, helping to optimize parameters and assess risk-reward ratios. Additionally, Paper Trading features enable live-like practice sessions without financial exposure, fostering confidence and refining execution skills.
Optimizing Your Trading View Experience for Better Results
Best Practices for Chart Analysis and Pattern Recognition
Successful trading depends on recognizing patterns such as head and shoulders, double tops/bottoms, or trend channels. Consistency in chart analysis involves developing a systematic approach—labeling key levels, confirming with volume or indicator signals, and maintaining discipline in pattern recognition. Incorporating multiple time frames ensures a comprehensive outlook.
Enhancing Workflow with Mobile and Desktop App Integration
Utilize Trading View’s dedicated apps for uninterrupted analysis. Mobile apps facilitate on-the-go updates, while desktop versions offer more detailed workspace customization. Synchronizing watchlists, alerts, and layouts across devices ensures a seamless trading experience and quick reaction times during volatile markets.
Tracking Performance Metrics and Adjusting Strategies Accordingly
Continuous improvement involves analyzing your trading performance through metrics such as win rate, average profit/loss, and maximum drawdown. Trading View’s custom charts and data exports support performance reviews. Based on these insights, traders can tweak strategies, refine risk management rules, and maintain disciplined trading habits.
Future Trends and Innovations in Trading View Technology
The Evolution of Charting Tools and AI Integration
Emerging trends include integrating artificial intelligence to predict market movements and automate pattern recognition. AI-powered tools can flag emerging trends or anomalies, enhancing decision accuracy. As Trading View evolves, expect smarter, more adaptive chart features tailored to individual trading styles.
Community-Driven Developments and Custom Scripts
Trading View’s open scripting environment, Pine Script, allows users to create custom indicators and alerts. Community contributions accelerate innovation, enabling traders to access unique tools tailored to niche strategies. This collaborative environment fosters continuous enhancement of analytical capabilities.
Anticipating Market Changes with Trading View Analytics
Advanced analytics, including sentiment analysis and macroeconomic overlays, are likely to become more integrated within Trading View. These tools help traders anticipate market shifts and adjust positions proactively—an essential feature in volatile environments.


